Election misinformation
At the recent General Election, THIRTEEN different organisations offered constituency level projections using a variety of methodologies. Huge amounts of information was pumped into the public arena with the intention of showing the media and the public the likely outcome of the election constituency by constituency.
The problem is that large amounts of that information was wrong and not just a little bit wrong either.
In our last article on this issue, we discussed the discrepancies between projections from different organisations. Now with the benefit of the final results, we can offer our final judgement on this.
But before we get to that, we should restate why this is a problem -
Polling results can have an impact on how people vote. If they are significantly wrong, then voters may end up making bad choices because of it.
The results of this polling are used by the media and third parties (eg tactical voting websites) to inform the public - when the data is wildly wrong, we get misinformation to the public.
The results of this polling can be used by political parties to reinforce tactical voting arguments in a constituency. That is highly problematic when data is inaccurate - misinformation can become disinformation.
Organisations can choose to use the most favourable data to reinforce a predefined narrative eg Party A is set to win in Constituency A OR Party A is set to be smashed in Constituency A.
Highly inaccurate data damages the reputation of the polling industry and politics more widely
A feature of all the polling in this election is that almost every poll suggested a far bigger Labour lead over the Conservatives than was actually achieved. Not one single poll predicted a 10% difference in vote share.
When it comes to projection sites, every one of them predicted a much greater number of Labour seats than were actually won. The range of projections ran from as low as 418 (7 out) through to 516 (105 seats out). Projections for the Conservatives ran as low as 53 seats (72 out) and as high as 125 (4 out).
But when we dive into individual seat projections, the problems get far worse.
Let’s look at 5 examples (there are a further 10 examples at the end - there are many, many more than that). Please note we have removed the names of the organisations to spare any embarrassment.
Chichester projections

Here we can see a party that barely held its deposit was predicted to win by one projection site - this could easily have been used to make an alternative tactical voting argument in this constituency.
Central Suffolk & North Ipswich projections

Even in a more straightforward Conservative vs Labour battle, we see a huge range of predicted votes and margin of victory.
Leicester East projections

No projection site got this right - the best result in any of them for the Conservatives was a 14% defeat.
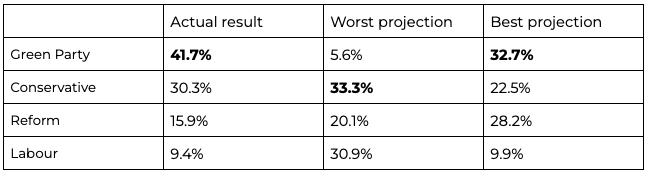
North Herefordshire projections

Three projection sites had the Greens at 10% or less. One site projected the result to be Conservative/Labour marginal with just 1.7% in it.
Skipton & Ripon projections

This time it’s Reform’s vote being wildly overestimated. Three different winners were projected by different sites including one which had a 16% Labour victory.
This simply isn’t working
Polling will never be perfect and every poll will have a margin of error. But the results above and in dozens more seats are on a different scale.
When you can’t tell if a party is in first place or fourth or even fifth place, there is a large problem. When you’re not sure if a party is winning comfortably or getting hammered, then you have to question the value of the data in front of you.
This is equivalent to one weather forecaster saying there will be a heatwave tomorrow and the another saying there will be a blizzard! It’s not just useless, it’s also potentially dangerous and undermines the credibility of the whole profession.
Thirteen different organisations set out with good intentions to provide voters and the media with reliable data. Unfortunately, a significant amount of that data has been shown to be junk and has become yet more misinformation.
And with that misinformation, we saw things like these -

Spoiler alert - all the projections above were very wrong. Please note we do not mean to single out any media organisation or political party, others will have done similar things.
We think the polling industry should think again about these projections.
We have gone from just a small handful of organisations doing this kind of work up to thirteen in a blink of an eye.
The reliability of the data has dropped rapidly in the process. Although the changing face of British politics may also have contributed. Historically constituency level projections work best in a two party system. They have always been less reliable predicting smaller parties.
In this election, over 40% of voters backed smaller parties. But that is still no excuse for putting potentially misleading information out into the public arena. We need the polling industry to do better than that.
We urge them to review their practices and consider very strongly whether these projections are allowed to be made public in this way. Or if they are allowed to continue, then a large health warning should be attached to every one!
Please note we would like to credit the fantastic website created by Peter Inglesby which allows all the different projections to be seen in one place.
Other examples of inaccurate projections
Ashfield projections

Berwickshire, Roxburgh & Selkirk projections

Cambridge projections

Caerfyrddin projections

Finchley & Golders Green projections

Islington North projections

North Shropshire projections

Stratford upon Avon projections

Tunbridge Wells projections

Waveney Valley projections